Using Mendz.Graphs
A good thing that came out of writing about my own work, it gave me a chance to rediscover and review what I did. When I first wrote Mendz.Graphs around a year ago or so, I was using .Net Framework 4.x. As of this week, after posting about the Graph yesterday, Mendz.Graphs is officially a .Net Core class library project.
I am currently using Visual Studio 2017. Since most of my original codes are retained, porting my old Mendz.Graphs to .Net Core is quite easy. I simply created a new .Net Core class library project, named it "Mendz.Graphs" (duh!), and added (the new) Vertex.cs, Edge.cs and Graph.cs files to it. I then added the NuGet package for ValueTuple as a dependency. There were no error messages so I clicked on Build and watched everything succeed so smoothly. I celebrated whole-heartedly with a delicious cup of affogato (a scoop of vanilla ice cream topped with a shot of Guatemala Antigua espresso)!
Building a class library project is one thing. Testing it out is even more exciting. I like creating a simple console application to immediately see the fruits of my labor. I know it's not exactly the best way to test, but it makes me happy, so please let me.
In Visual Studio, I created a .Net Core console application and named it TestGraph. I added a reference to Mendz.Graphs. Then, in Program.cs Main(), I put the following code:
Pretty cool, right?
Update: Consider using http://www.webgraphviz.com/ to render your graph's DOT notation. This tool works better most of the time.
I am currently using Visual Studio 2017. Since most of my original codes are retained, porting my old Mendz.Graphs to .Net Core is quite easy. I simply created a new .Net Core class library project, named it "Mendz.Graphs" (duh!), and added (the new) Vertex.cs, Edge.cs and Graph.cs files to it. I then added the NuGet package for ValueTuple as a dependency. There were no error messages so I clicked on Build and watched everything succeed so smoothly. I celebrated whole-heartedly with a delicious cup of affogato (a scoop of vanilla ice cream topped with a shot of Guatemala Antigua espresso)!
Building a class library project is one thing. Testing it out is even more exciting. I like creating a simple console application to immediately see the fruits of my labor. I know it's not exactly the best way to test, but it makes me happy, so please let me.
In Visual Studio, I created a .Net Core console application and named it TestGraph. I added a reference to Mendz.Graphs. Then, in Program.cs Main(), I put the following code:
Graph graph = new Graph();
Console.WriteLine("Adding vertices...");
int order = 5;
for (int i = 1; i <= order; i++)
{
    graph.AddVertex(i, i);
}
Console.WriteLine("Adding edges...");
Random random = new Random();
bool directed = false; // true
int size = 5;
for (int i = 1; i <= size; i++)
{
    graph.AddEdge(random.Next(1, order + 1), random.Next(1, order + 1), directed);
}
Console.WriteLine(graph.ToString());
Console.WriteLine("Press any key...");
Console.ReadKey(true);
I added the necessary "using" statements on top, saved everything and clicked on Debug. In the console that launched, the program created a graph instance, populated its vertices, populated its edges and wrote the graph's DOT notation on screen. I got something like this:
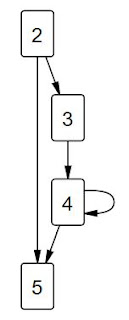
graph G {
 2 -- 3;
 2 -- 5;
 4 -- 5;
 3 -- 4;
 4 -- 4;
}
I then selected and copied the resulting DOT notation to the clipboard. I went to http://rise4fun.com/Agl/helloworld. I cleared the sample Hello World entry and pasted my graph's DOT notation in the text area. I then clicked on the big play button -- if you're following along and lucky (the tool doesn't always work for some DOTs), you'll see your graph drawn quite nicely. My graph rendered like so:
Pretty cool, right?
Update: Consider using http://www.webgraphviz.com/ to render your graph's DOT notation. This tool works better most of the time.
Comments
Post a Comment